Searching for winter: When will Minnesota reach the 'snow turning back' point?
Oct 31, 2022 12:06PM ● By Content Editor
By Sven Sundgaard - Bring Me The News - October 27, 2022
Winter. You either love it or hate it or … you’re just fine with it taking its time.
For meteorologists and climate watchers it’s another major phase and we’re constantly on the lookout for signs of pattern consistency this time of year. Despite an earlier than normal snowfall this fall and an unusually early cold snap, signs of the impending switch to winter are anything but consistent or imminent.
While every year is different, statistics and averages help us understand when consistently wintry weather typically sets in across Minnesota. One such average is the date of the first 1-inch snow cover. This isn’t when the first snowfall occurs, but when at least 1 inch of snow sticks on the ground for at least one day. Think of it as the point in which there's really no turning back.
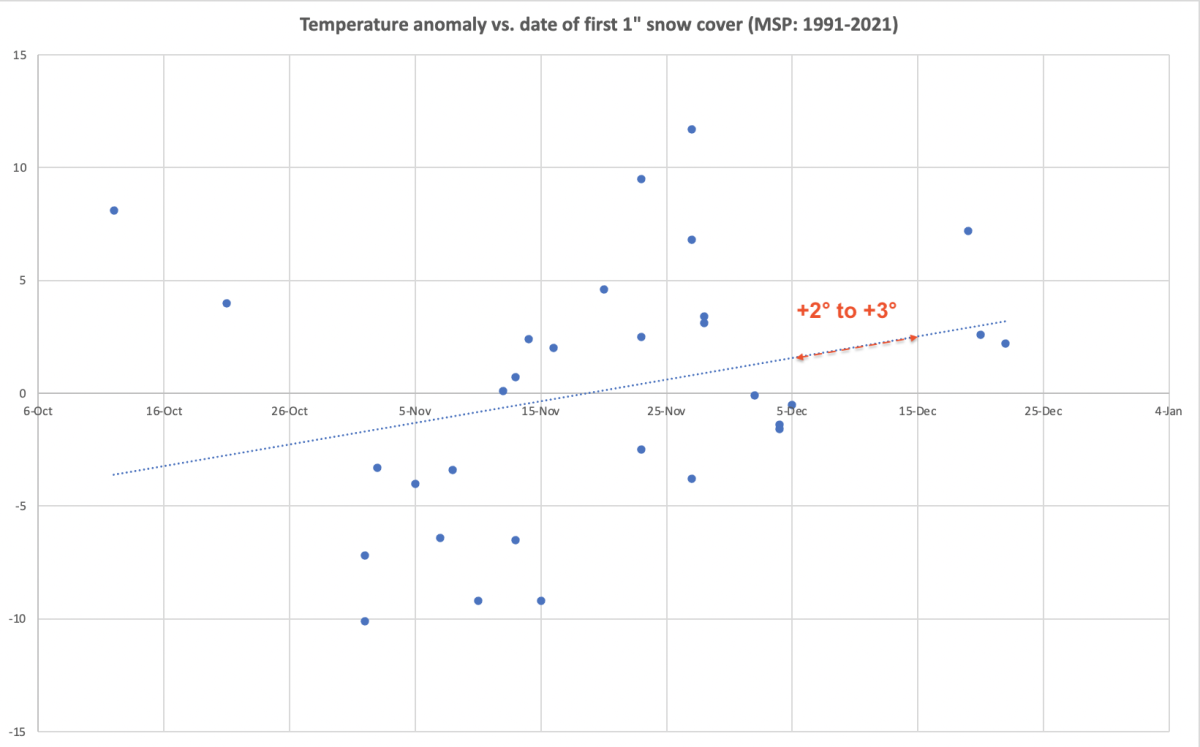
As one might expect, the warmer the November, the later the snowpack develops. It's not a perfect line, but there is a clear trend and on average we reach that point of winter where we can't turn back on Nov. 24.
What's going to happen this year?
The overwhelming consensus in the long-range computer models is to continue the mild trend we’ve seen this fall. October is likely to end up about 2 to 3 degrees above normal, which is similar to September. Guess what? Pretty much all the models are forecasting similar anomalies for November.
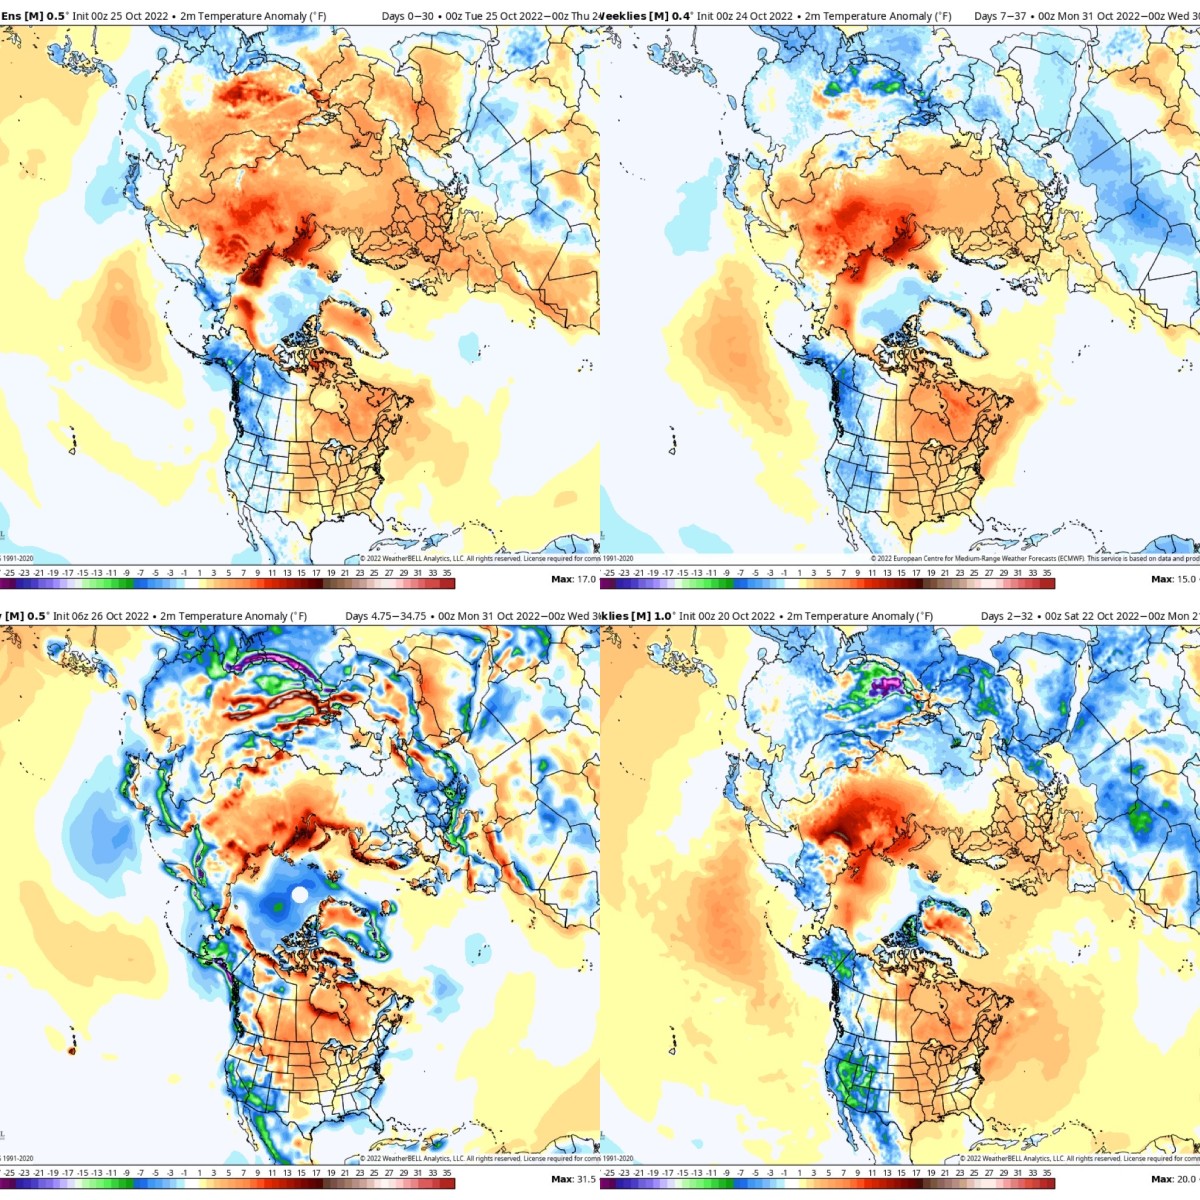
The orange coloring over Minnesota in all of the models suggests a warmer than normal November.
WeatherBell
The range in these four models is from +1 to +4 degrees (F) above normal, but ALL are forecasting warmer than normal temperatures. If we extrapolate that to the chart above, solely looking at climate statistics, we come up with Dec. 5-15 for the first 1-inch snow cover. That would be 10 days to possibly 2 or 3 weeks later than the historical average.
Does this mean we're waiting for winter until the first two weeks of December? No, these are just statistical correlations. This October is a great example of how we can average 2 or 3 degrees above normal but also have an anomalous cold outbreak and an unusually early snowfall in the Twin Cities.
Something brewing in late November?
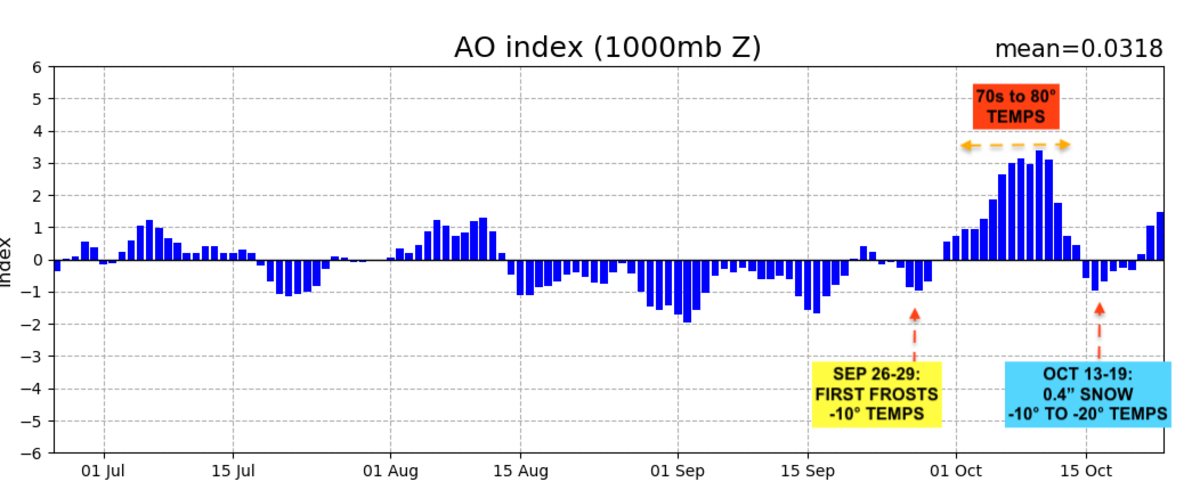
In the short term (into first 10 days of November), the Arctic Oscillation index (AO index), which is a helpful tool for looking into the future, suggests near normal or mild conditions in Minnesota.
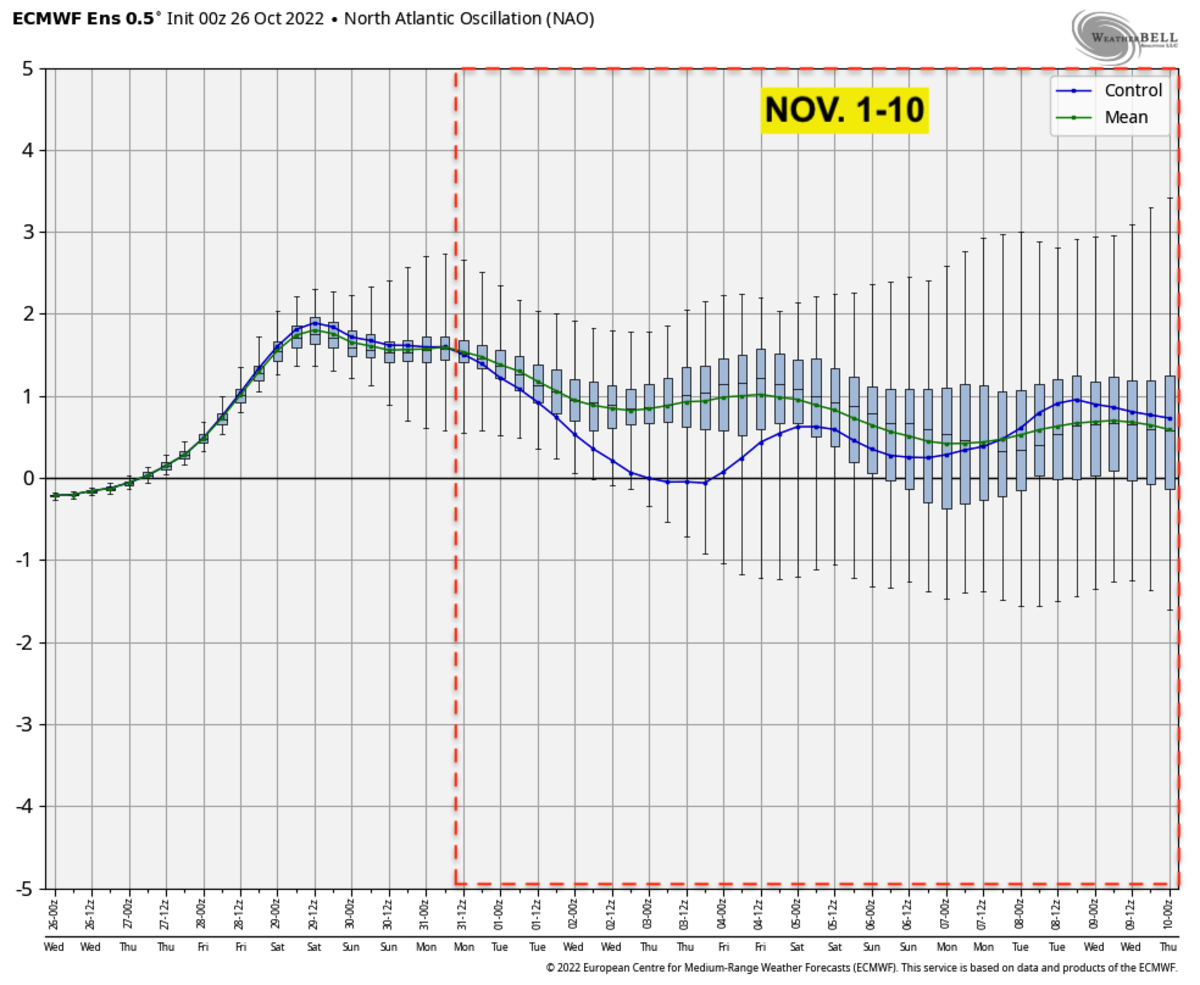
Here’s a look at the European model ensembles (many different runs and tweaks of the model). It shows temps in Minnesota hanging right around the averages for the first 10 days of November.
The Canadian and American models look very similar.
In the longer range, things become more chaotic, as you would expect. Forecast possibilities diverge all over the place the farther in time we get. That’s why I started this article saying that we’re looking for consistency in forecast patterns. Both the long-range European and American models see temps dipping below normal later in November.
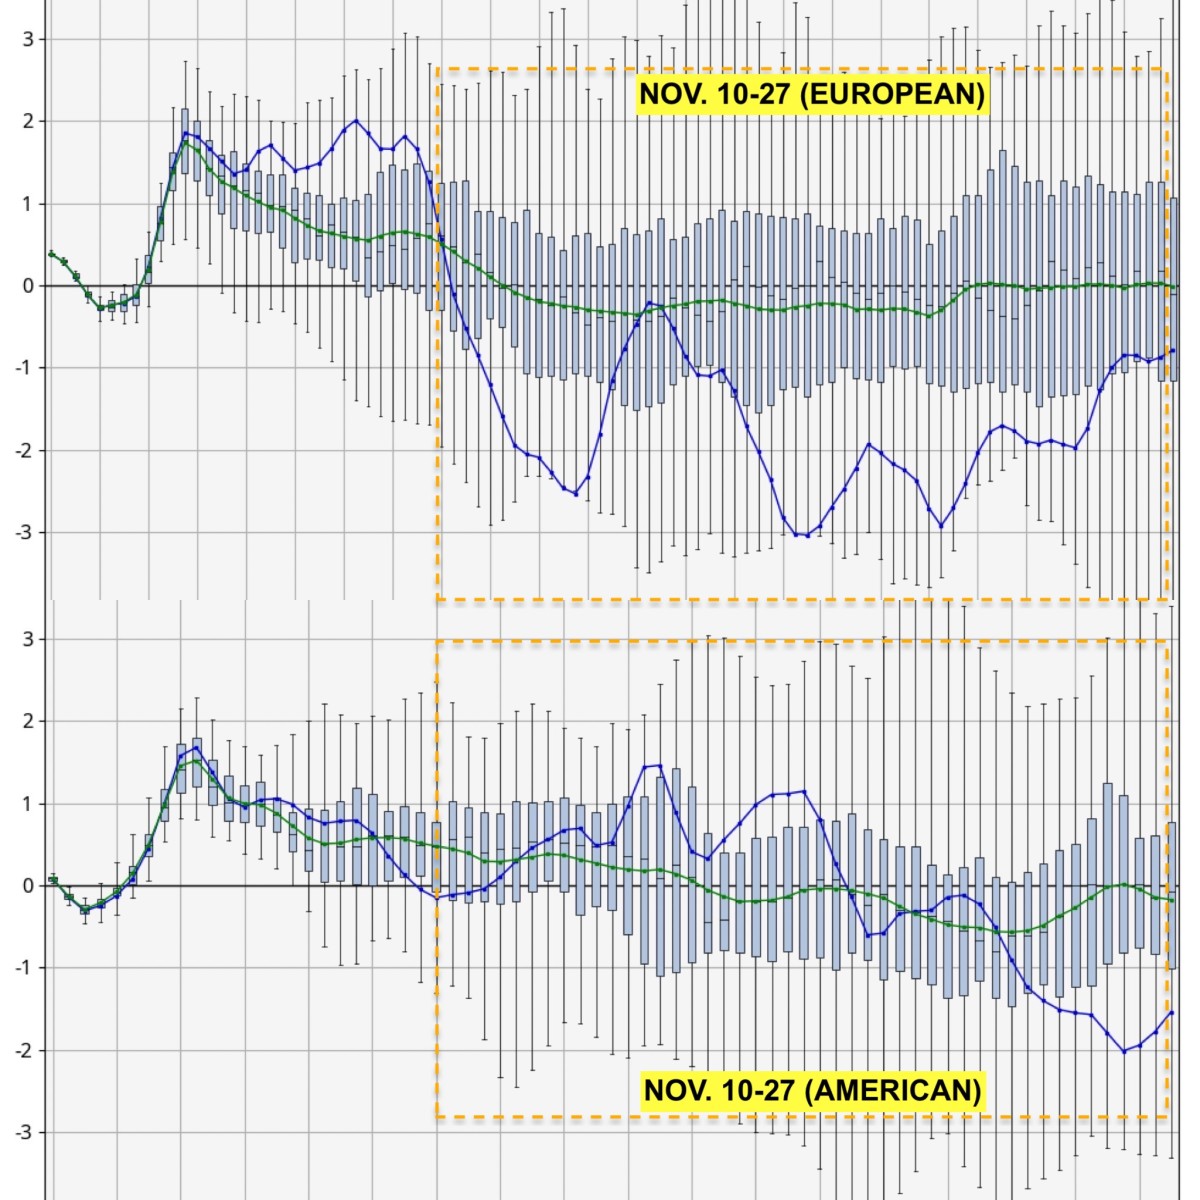
This might look messy, and it is. The individual bars are all the temperature ranges within the model (literally all over the place). The blue line is the control, or specific model run. The green line is the mean, literally the average of all the possibilities.
The chart above can help filter out the noise and find a consensus. The European ensembles differ on mid-November, but you can see a trend for late November that would bode well for colder, stormier weather. I have to preface this by saying that every couple days these solutions have looked different so this is hardly locked in.
Indeed, we see a similar pattern if we look at he long-range snowfall possibilities. No model can accurately forecast specific snowfall past a week, but the chart below is the meteorological version of Netflix. There is something brewing in the pattern. Whether we get 1 or 15 inches of snow is anyone’s guess, but the probability of seeing snowier and colder conditions definitely increases later in November.
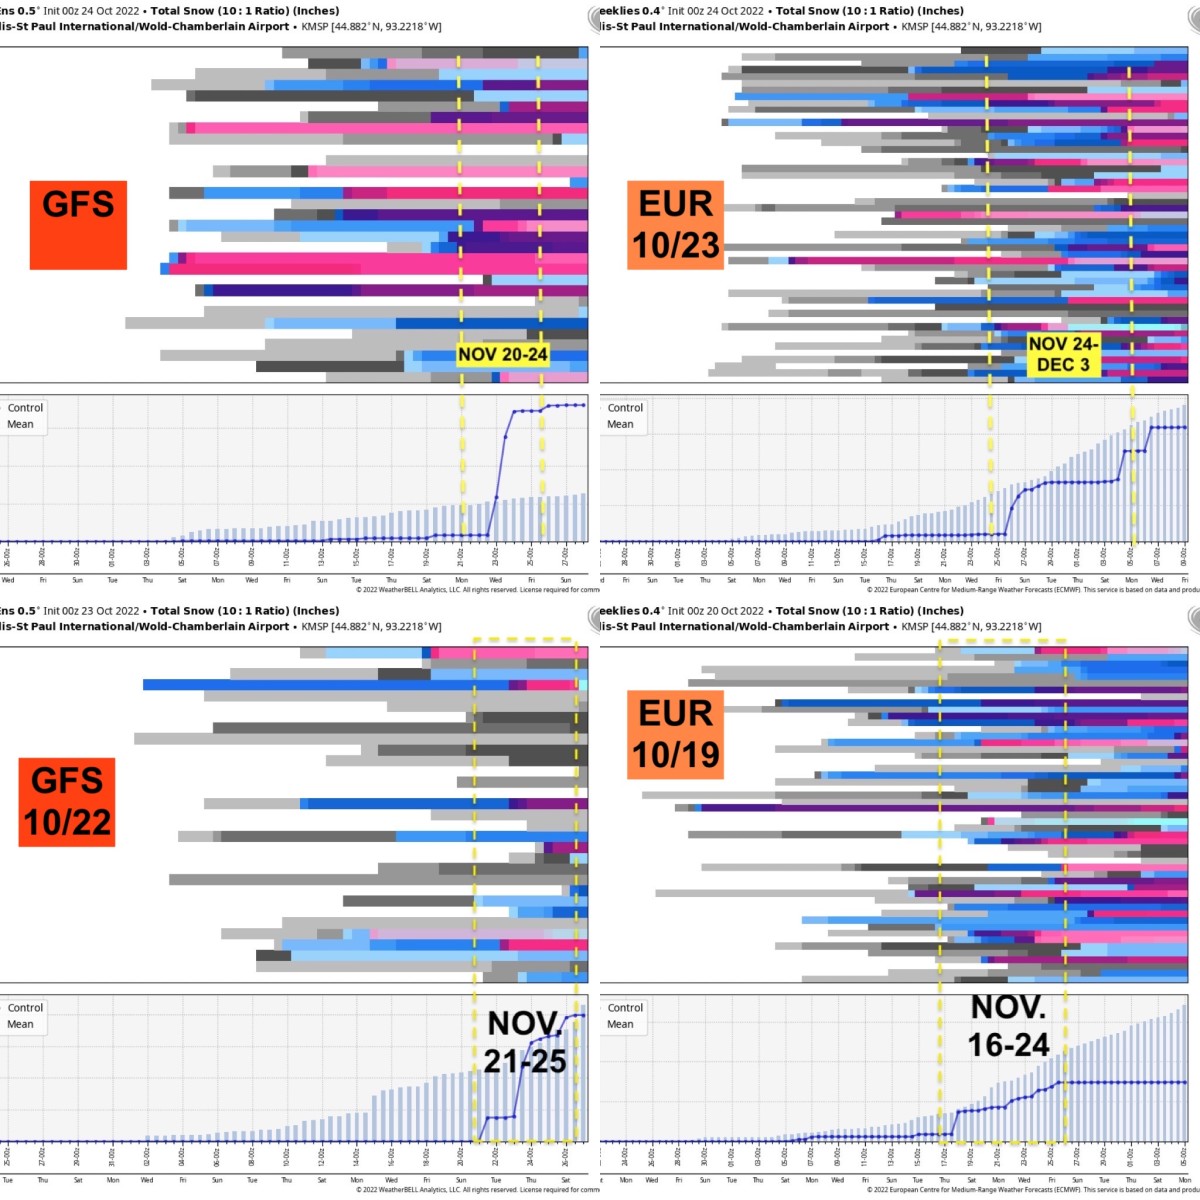
DISCLAIMER: This is mere meteorological entertainment. No model can forecast specific snowfall accurately past a week.
You might be saying, "no s***, Sherlock," but remember, the 30-year climatological norms support cold temps and stormier weather at the end of November, so when the models hint at a distinct, end of month change, we pay attention.
As usual, it’s wait and see for anything past 7 days, but hopefully you understand a little bit more about how the meteorological sausage is made when it comes to winter weather forecasting.
More about the Arctic Oscillation index
In long-range forecasting, looking at statistics and models are your best bets, especially when looking at large-scale patterns. One such pattern meteorologists look at a lot in the cold season (fall through early spring) is the Arctic Oscillation, also known as the AO index. It provides a really good view of the hemispheric pattern.
We can analyze the models from continent to continent many days or weeks out to get the same picture, but this gives us a quick look at differences between the arctic and the mid-latitudes.
Here's the basic idea:
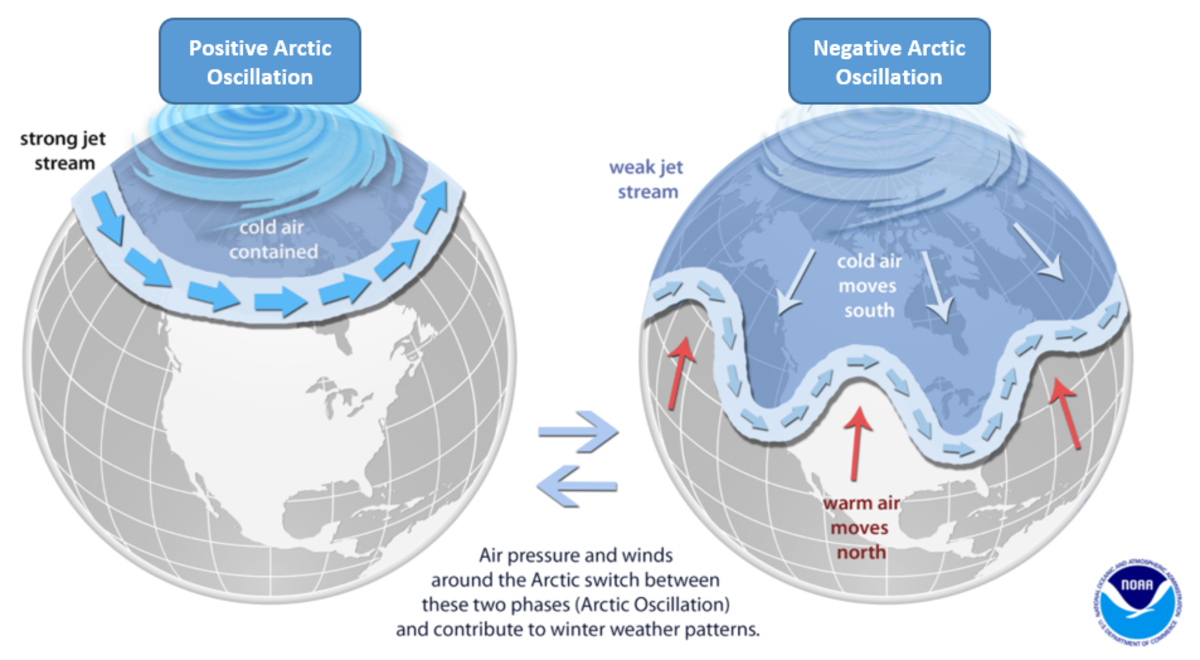
The AO index measures the difference from normal (anomalies) between the arctic, mid-latitude and subtropic pressure patterns. This matters because it can tell us how strong or weak the jet stream is that dominates the balance between cold and mild and storm tracks in our region.
When the AO is in a positive phase, it means the air pressure is lower than normal in the arctic. Cold air is contained, and the jet stream blows strongly west to east around the northern hemisphere. This keeps the overall storm track farther south and places mid-latitudes like Minnesota in a pattern known to producer milder than normal or near average temps.
When the arctic oscillation (AO) turns to a negative phase, air pressure over the arctic is higher than normal and indicates a weaker pattern from normal that allows a very wobbly jet stream and protrusions of cold air deep into mid-latitudes, in places like Minnesota, the northeastern U.S. and Europe. This also pushes major storm tracks south and creates some major snowstorms for areas east of the Rockies. If you’re a winter lover, you want to see negative AO phases.
The AO is a great overview of these complex blocking patterns and can measure disruptions to the polar vortex which create the same conditions outlined above (i.e. extreme cold blasts farther south and stormy patterns on the edges).
For example, we’ve already had some briefly negative AO phases this fall that led to our first cool snap in late September. Remember, we went from 92 degrees to the first frost for many parts of Minnesota. The recent mid-October cold snap was another negative AO phase that brought an earlier than average snowfall and pretty cold air for a few days.