Are Great Lakes water levels headed up in 2018?
Nov 15, 2017 10:17AM ● By Editor
By Mark Breederland, MIchigan State University Extension, Michigan Sea Grant - November 13, 2017
Fall of 2017 was a very wet season in the Great Lakes region. According to the US Army Corps of Engineers, basin-wide precipitation was well above normal for all of the Great Lakes during October 2017. In fact, these estimates put the monthly precipitation at 118 percent of average for Lake Superior, 161 percent of average for Lakes Michigan/Huron, 107 percent of average for Lake Erie, and 170 percent of average for Lake Ontario. Accordingly, while the lakes generally continue seasonal decline into winter, the rate of this decline has been much more gradual.
Lake Superior Monthly Mean Water Levels

What impact has this high precipitation had in various lakes? In late October all the Great Lakes rose slightly from the typical pattern (that is lower at the end of the month than at the beginning). Currently in mid-November, Lake Superior is hovering around its October average when it typically is a bit lower in November. Lake Michigan and Huron showed over an inch bump up around Oct. 24, 2017 – over 780 billion gallons of water across this 45,300 square mile surface area of the earth. Net basin supply estimates (the net result of precipitation falling on the lake, runoff from precipitation falling on the land which flows to the lake, and evaporation from the lake [negative net basin supply denotes evaporation exceeded runoff and precipitation]) and the outflow from the upstream lake were all above average during October.
Evaporation a factor
We know evaporation is a huge factor in lake level prediction and yet it is extremely hard to measure. The NOAA Great Lakes Research Lab and The Cooperative Institute for Great Lakes Research hosted a recent webinar, “Ten Years of the Great Lakes Evaporation Network: Progress Made and Opportunities for the Future” by Dr. Christopher Spence, research hydrologist from Environment and Climate Change Canada. The work done over the past decade is helpful to try to understand big and smaller years of evaporation and yet recognizes significant complexity in locating instruments on the Great Lakes. Some research-based information confirms that typically, the largest evaporation over the lakes occurs in November and December, when the lakes are still warm and the cold arctic air blasts come over the lakes.
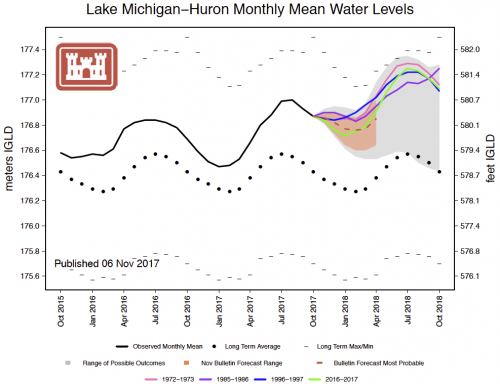
The main coordinated model for Great Lakes water levels used by the US Army Corps of Engineers doesn’t project out beyond 6 months. However, a newer product The Great Lakes Water Level Outlook, details that the high water levels of this year were accompanied by a strong seasonal rise due to wet spring conditions and high net basin supplies to the lakes. It also compares to some years when there were periods of positive net basin supply during the years 1972-1973, 1985-1986, and 1996-1997 - representing periods of high water levels and high net basin supply throughout the year across the Great Lakes basin.
 ee scenarios
Snowpack key
Considering these scenarios, it is quite possible 2018 may be a high water year in several of the Great Lakes. One thing to watch for over the winter is the amount of system snowpack over the Lake Superior basin. Lake-effect snows are considered net-system losses (they come back long-term) but system snow pack is usually measured in March by NOAA’s National Operational Hydrologic Remote Sensing Center. NOAA is trying to determine how much liquid water is “locked up” in the frozen snowpack, technically called snow-water equivalent. Fixed wing aircraft flying with remote sensing gamma radiation sensors at about 500 feet above the ground around the Lake Superior basin can give good estimates of snowpack. Naturally occurring gamma radiation is released from the soil under snowcover and can indicate snowdepth.
Higher lake levels impacts shoreline erosion; fall is typically the time of year for sustained storms. In fact, a Lake Superior buoy north of Marquette, Mich., measured a 28.8 foot wave at Granite Island on Oct. 24, 2017 – the highest wave ever recorded by modern buoy records (10-30 years). Significant erosion has been reported near Whitefish Point. Yet the rise and fall of the Great Lakes is still normal and key for nearshore wetland ecological health and nearshore habitat.
Here’s an overall lake level synopsis – higher levels but not all time highs. Lake Superior is 13” above its long-term average for October and 7” higher than 2016. Lake Michigan/Huron is 19” above its long term average for October and 9” above 2016. Let’s keep an eye on system snow in 2017-2018 and see what evaporative losses show – but it appears we might well be in for a higher season in 2018.
Please contact Extension educator Mark Breederland, [email protected], for more information on living with the ever-changing dynamic coastlines of the Great Lakes.
